
Eric Van Nostrand, Assistant Secretary for Economic Policy (P.D.O.)
Two well-documented facts characterize infrastructure investment in the United States: it has fallen in recent decades and reversing that decline would deliver meaningful economic benefits.1 Investing in our infrastructure can strengthen our long-term productive capacity while creating opportunity for Americans in disadvantaged communities. That combined focus on growth and broadly spreading economic opportunity is the foundation of what Secretary Yellen has called “modern supply-side economics,” an important element of President Biden’s Investing in America agenda.
Two years ago, President Biden signed the Bipartisan Infrastructure Law (“BIL”) into law. The BIL directs $1.2 trillion of federal funds towards transportation, energy, and climate infrastructure projects, most of which is distributed via state and local governments. On the BIL’s second anniversary, we review recent trends in the economics of American infrastructure. We offer three key conclusions:
- State and local capital investment—a major component of U.S. infrastructure spending—has grown as a share of state and local spending over the past two years by the largest amount since 1979. Even though infrastructure investment typically falls as a share of the economy at the beginning of economic recoveries, the United States has bucked that trend during this recovery.
- BIL funding announced to date is flowing to the states that need it most: states with the lowest-rated infrastructure are receiving more funding per capita than states with the highest-rated infrastructure.
- Historically, states with higher median household incomes tended to invest more in infrastructure. But the BIL has helped reverse that pattern, as lower-income states have tended to receive more BIL funding per capita.
Macroeconomic Perspective
The multi-decade downward trend in U.S. infrastructure investment before the BIL is well documented.2 Since most federal infrastructure funding flows through state and local governments, one way to gauge the overall trend is to consider state and local gross investment in equipment and structures (“capital investment” hereafter). Because most federal BIL funding also flows through state and local governments, we consider the history of state and local capital investment as a proxy for infrastructure investment. 3
Figure 1. Infrastructure investment has trended down for decades and fell sharply during the pandemic, but has rebounded over the past two years.
As shown in Figure 1, the share of their budgets that state and local governments devote to capital investment fell sharply in the 1970s and early 1980s before stagnating and drifting downwards over the decades that followed. During the COVID-19 pandemic, state and local capital investment fell in lockstep with broader economic output. But during the first year of the recovery, it did not keep pace with the sharp rebound in economic activity and fell sharply as a share of the economy. Since the BIL passed, though, state and local capital investment has rebounded and returned to pre-pandemic levels. The two-year increase in state and local capital investment as a share of state and local spending—1.6 percentage points—is the largest since 1979.
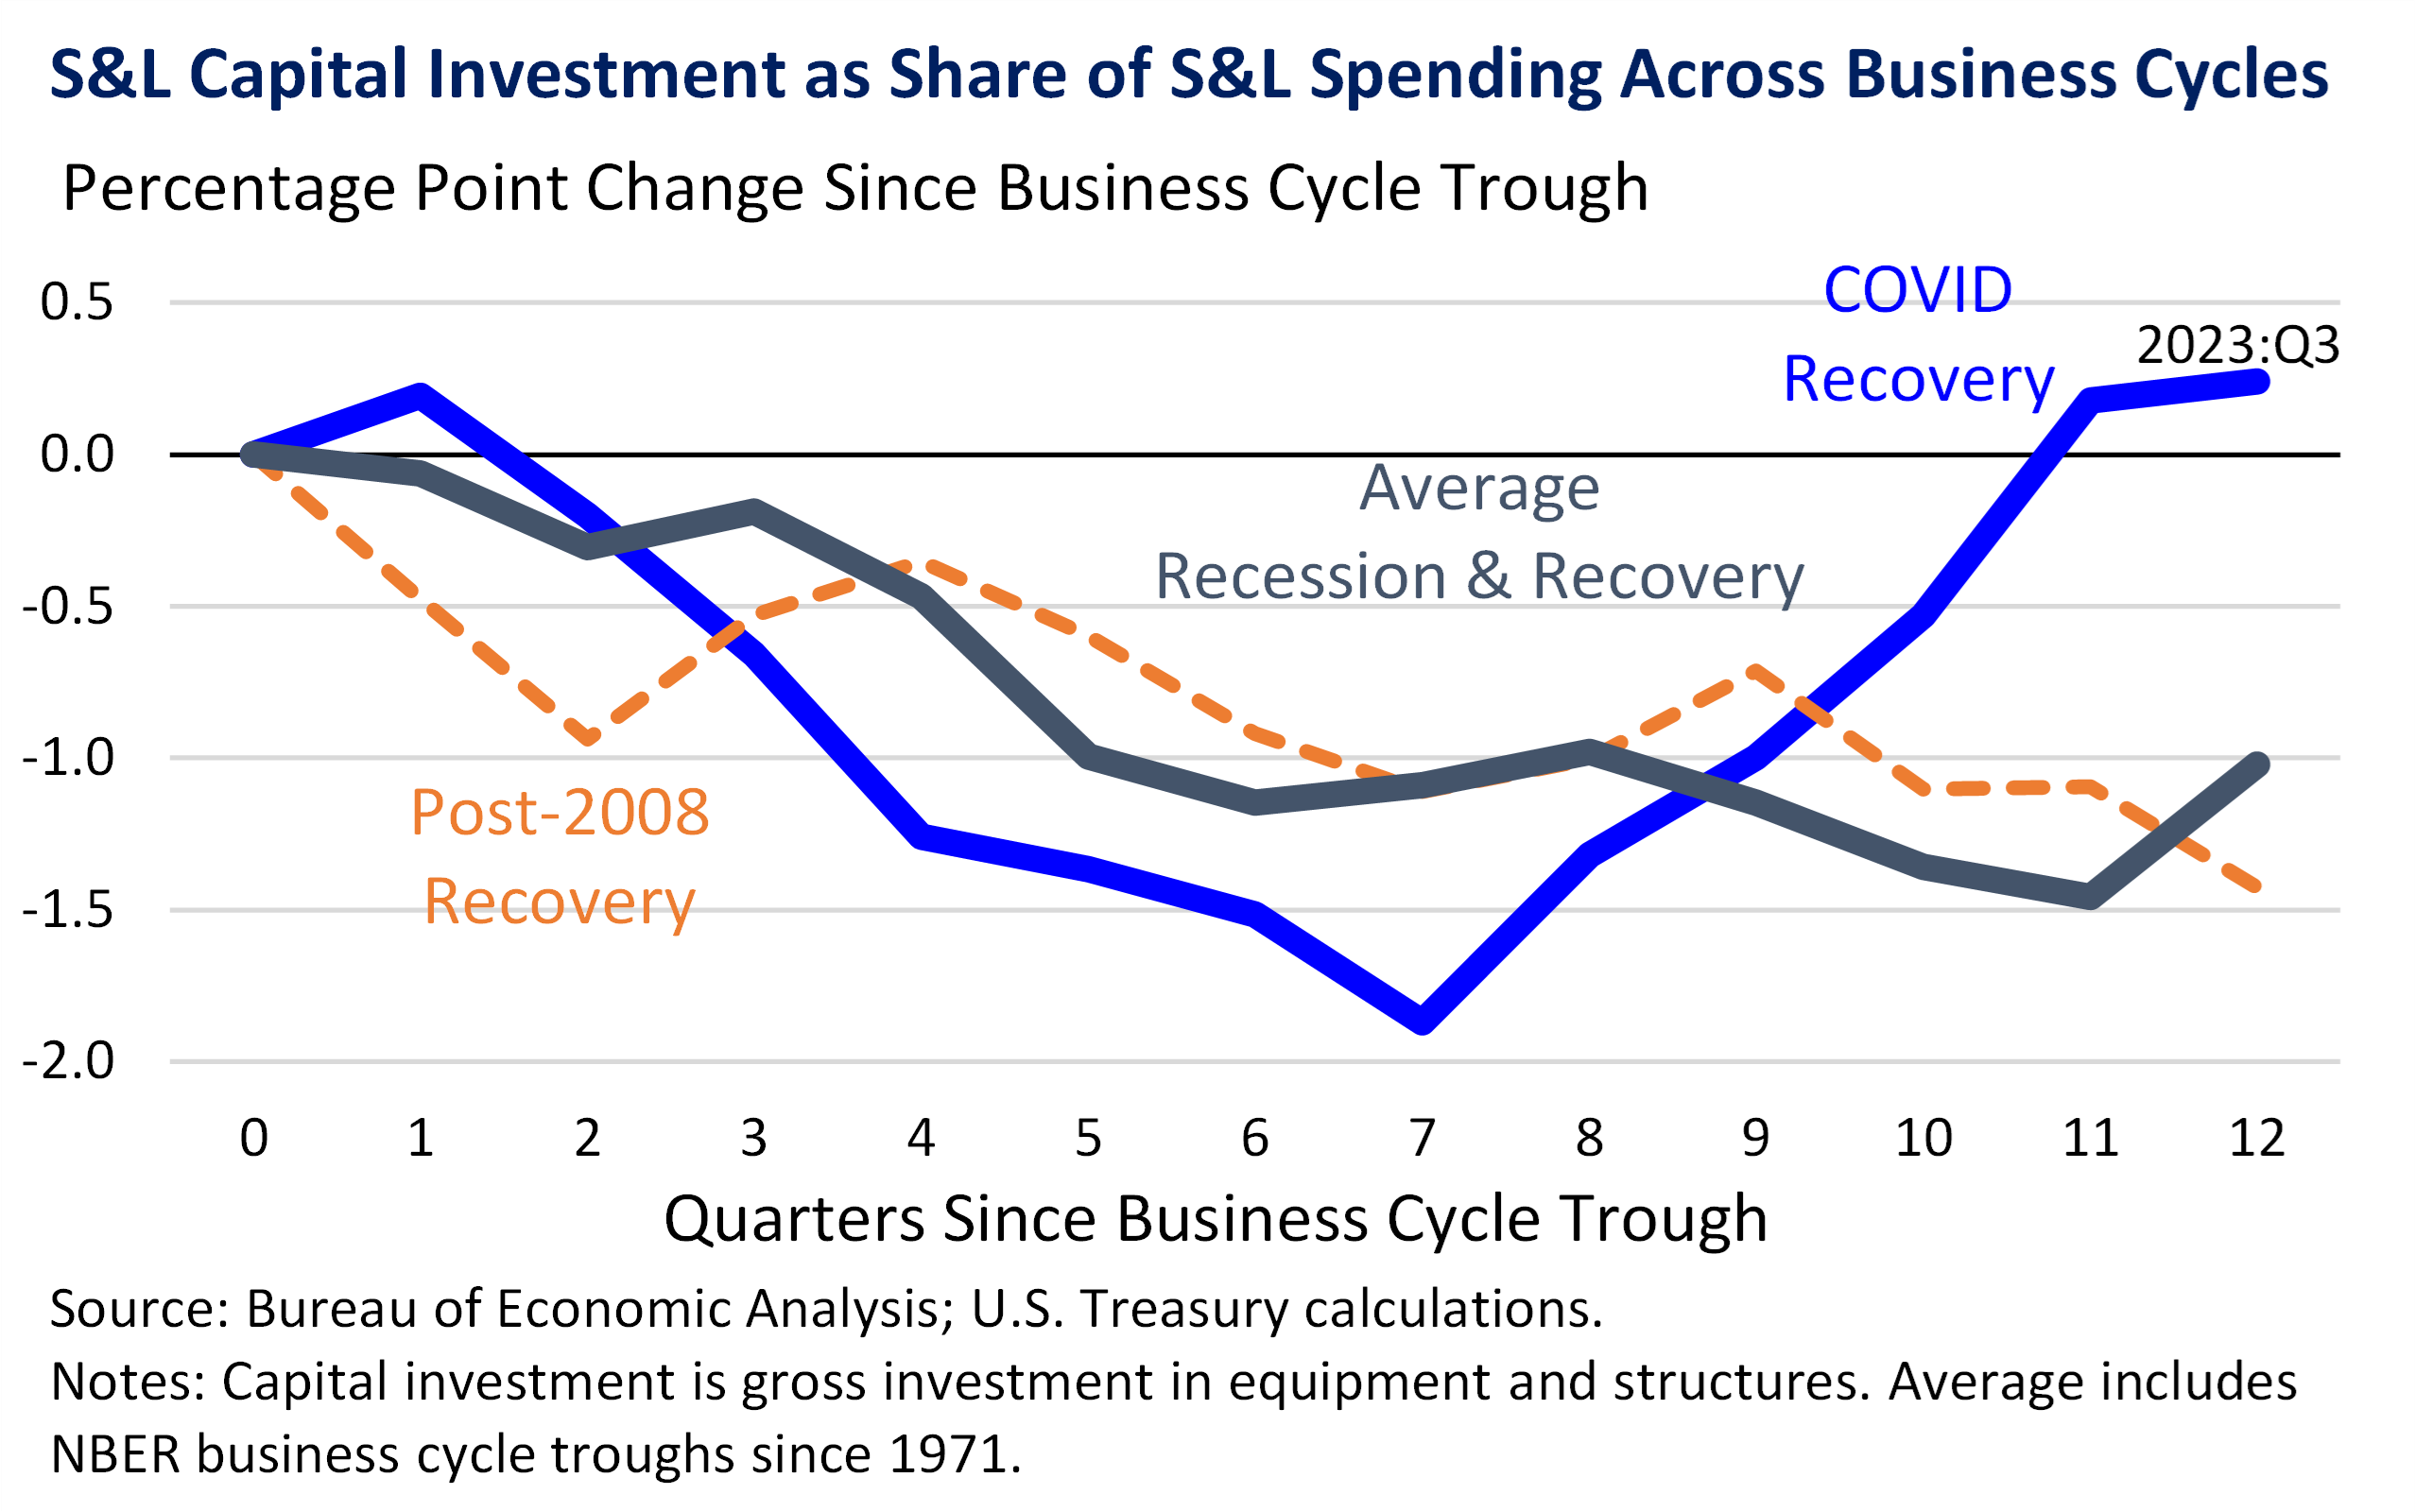
Indeed, state and local capital investment typically falls as a share of total state and local spending during economic recoveries, as governments tend not to increase their infrastructure investment just as the economy is rebounding. Figure 2 shows that this recovery conformed to that typical pattern for about the first year and a half of the recovery, into the beginning of 2022. In some sense, such countercyclical investment is intuitive: perhaps infrastructure investment is most beneficial in recessions when job creation is most important. But the initial response to the COVID recession was understandably not focused on conventional public infrastructure. Since the BIL was passed in 2021, capital investment has bucked the typical trend and recovered sharply.
Figure 2. Infrastructure investment tends to fall as a share of total state and local spending during the first few years of an economic recovery, but since 2022, this recovery has bucked that trend as infrastructure has rebounded.
The Bipartisan Infrastructure Law: Directing Funds to States That Need It Most
The pre-BIL decline in infrastructure investment has been broad-based. Figure 3 plots the change in state and local capital investment across states (as a share of GDP by state) from 2009-2021, from the business cycle trough in the Great Recession to the passage of the BIL. Forty-two states saw declining infrastructure investment as a share of their economies over this period.
Figure 3. The decline in infrastructure investment over the prior business cycle was broad-based across states.

To track project announcements related to the BIL, the White House launched Invest.gov. We previously examined Invest.gov data on private investments related to the Inflation Reduction Act; here, we review Invest.gov data on announced projects financed by the BIL, including specific discretionary projects and formula-based allocations to state and local governments.4 Analyzing announcement data requires particular care, but there are important lessons to be gleaned in the robust set of investments announced so far.
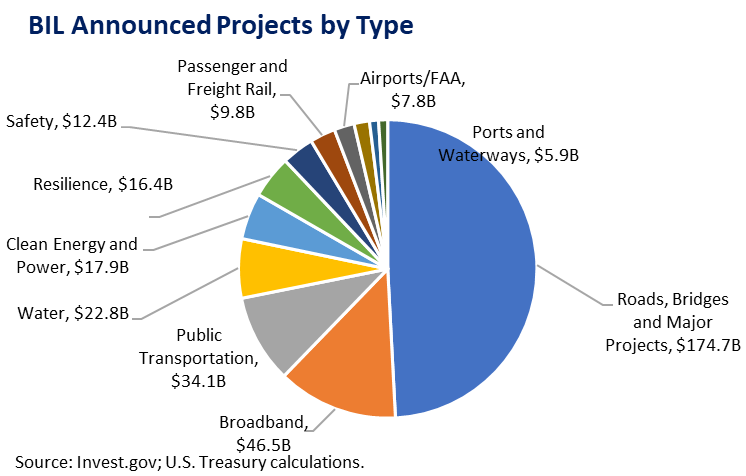
Invest.gov tracks more than $350 billion in announced BIL funding through October 2023. About half the BIL announcements to date focus on major projects like roads and bridges, but a variety of other uses are included as shown in Figure 4. Broadband, public transportation, water infrastructure, and clean energy are especially important contributors.
Figure 4. About half of BIL project announcements focus on roads, bridges, and other major projects.
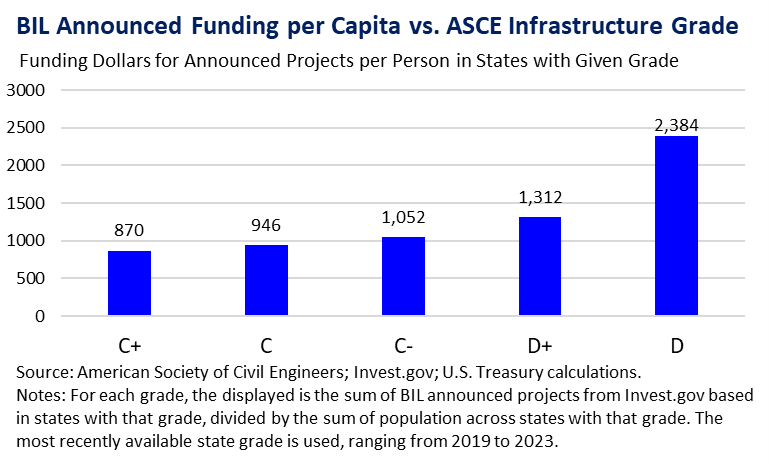
One conclusion from these data is that BIL funding is concentrated in the areas that need it most. The American Society of Civil Engineers (ASCE) grades states on the quality of their infrastructure across several dimensions including roads, bridges, water, and public transit. Overall infrastructure grades for U.S. states range from C+ to D—itself a recognition of the challenged state of our infrastructure overall that the BIL looks to address. Figure 5 shows the announced BIL funding per capita for states at each grade level, showing that states with lower overall grades are receiving more funding per capita. This finding increases confidence that the money is going to the places that outside experts suggest need it most.
Figure 5. States with the lowest-rated public infrastructure are receiving more BIL funding per capita than states with the highest-rated infrastructure.
Geographic Distribution of BIL Announcements
While pre-pandemic infrastructure investment tended to be higher in states with higher household incomes, BIL announcements have the opposite pattern: lower income states are tending to capture more infrastructure investment.
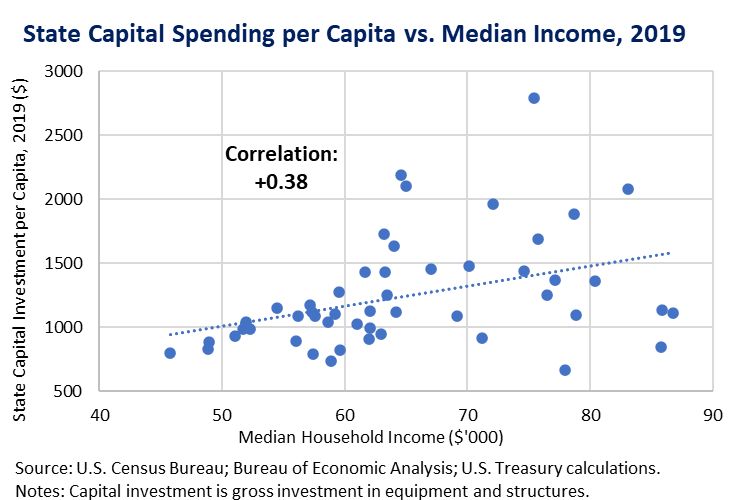
Figure 6 shows that states with higher incomes historically tend to invest more in infrastructure per capita than lower-income states. In 2019, state-level capital investment per capita was 38 percent correlated with state-level household income. In some sense, that is to be expected: states with higher household incomes have more tax revenue per capita to invest in infrastructure.
Figure 6. Before the pandemic, state and local infrastructure investment was higher in states with higher household incomes…
Notably, though, BIL announcements do not show this pattern. As shown in Figure 7, there is no significant relationship between BIL funding per capita and household income across states. This suggests that BIL announcements reflect a more equitable distribution of infrastructure investment than is normally the case.
Figure 7. …but announced BIL data does not show this relationship, as state income levels are not related to their BIL funding…
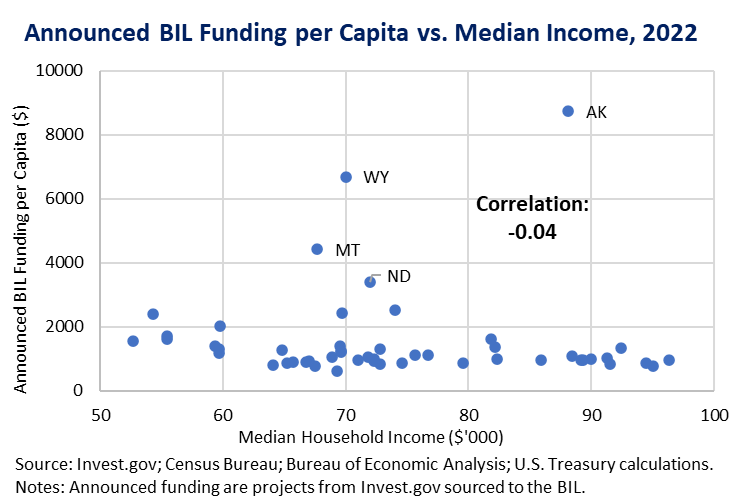
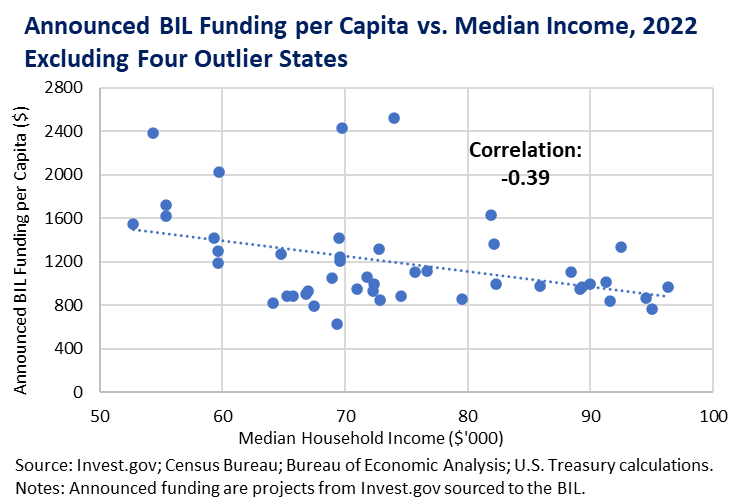
Moreover, it is clear from Figure 7 that four states—Alaska, North Dakota, Montana, and Wyoming—have seen disproportionate BIL funding per capita. These states have low populations, so one or two significant infrastructure investments greatly increases capital spending per resident. Figure 8 shows that without these four outliers, the relationship between BIL funding and GDP per capita turns negative, suggesting that BIL funding is being directed toward states with lower incomes.
Figure 8. …and when removing the distortion from the four rural states with low populations, the relationship flips: BIL funding is tending to go toward lower-income states.
Moreover, investments in lower-income areas are not only good for equity: they can also offer higher economic returns, as areas with more distressed job markets or other disadvantages have more economic slack that can be closed with public investment.5
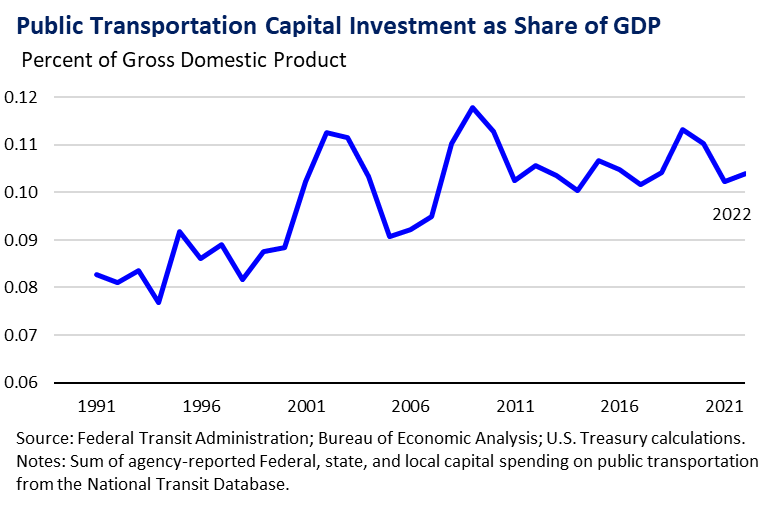
To illustrate this point further, we consider BIL announcements on public transportation—an especially important component of our national infrastructure with respect to equity and the environment. Less wealthy Americans are more likely to rely on public transit, and reliable public transit encourages everyone to reduce gasoline use. Historically, capital investment on public transportation has been strikingly small—about 0.1 percent of GDP as shown in Figure 9. Most wealthy countries are spending more, and China spends ten times as much.6 Somewhat encouragingly, though, U.S. transit spending has been on a gradual uptrend over the past few decades. BIL announced funding includes more than $34 billion for public transportation already, itself more than a year’s worth of all capital spending on public transit by federal, state, and local governments.
Figure 9. Capital investment in public transportation is small in aggregate—about 0.1 percent of GDP—but has grown steadily over the past few decades.
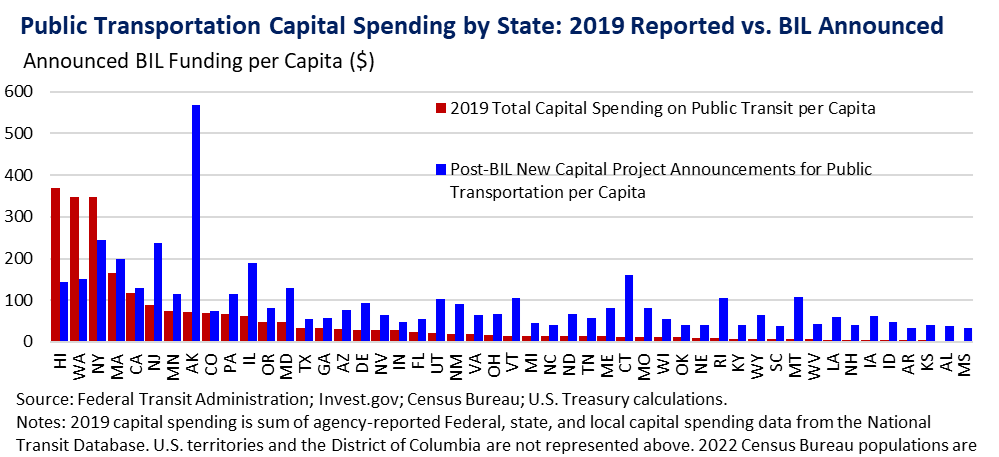
It will surprise no one that capital spending on public transportation is typically concentrated in large states with large cities. And it makes sense that densely populated areas will see more value in public transit than lower-density areas. Nonetheless, BIL announcements include important transit investments in a wider range of states than has been the case in the past. In 2019, only five states accounted for about two thirds of all investment in public transit. Those five states account for only about 40 percent of announced BIL funding.
Figure 10 compares per-capita pre-pandemic capital spending on public transportation by state with per-capita BIL funding announcements. The red bars plot 2019 investment; the blue bars plot BIL announcements. In 2019, Hawaii and Washington invested the most per capita on public transportation, followed by New York, Massachusetts, and California. The blue bars show the distribution of BIL announcements, which is much more even across states. Thirty-eight states are receiving more than twice as much BIL transit funding per capita as their pre-pandemic annual transit investment; twenty states are receiving five times as much; and ten states are receiving ten times as much.
Figure 10. Per-capita public transportation announcements from BIL funding are much more evenly distributed across states than typical transit investments.
Conclusion
It is still too early to assess the full economic benefits of the Bipartisan Infrastructure Law: much of the BIL’s impact on productivity growth will materialize only in the long term. However, there is much reason to be encouraged by the trends observed so far. Not only is the surge in state and local capital spending macroeconomically significant—the largest two-year increase since 1979—but the funding is landing in the places that need it most, those states with lower-rated infrastructure and those states with lower median household incomes. The BIL is an important example of President Biden’s commitment to grow our economy for the long run in an especially equitable manner.
1. Labonte, Marc. 2018. “Economic Impact of Infrastructure Investment.” Congressional Research Service, report no. R44896, January 24, 2018. https://crsreports.congress.gov/product/details?prodcode=R44896.; Gechert, Sebastian. 2015. “What fiscal policy is most effective? A meta-regression analysis.” Oxford Economic Papers, vol. 67, no. 3, July 2015, pp. 553–580. https://doi.org/10.1093/oep/gpv027.; Ramey, Valerie A. 2021. “The Macroeconomic Consequences of Infrastructure Investment.” In Economic Analysis and Infrastructure Investment, edited by Edward L. Glaeser and James M. Poterba, pp. 219–268. University of Chicago Press.
2. Labonte (2018).
3. See, for example, McNichol, Elizabeth. 2019. “It’s Time for States to Invest in Infrastructure.” Center on Budget and Policy Priorities, March 19, 2019. https://www.cbpp.org/research/its-time-for-states-to-invest-in-infrastructure.
4. Data is derived from the White House’s Invest.gov data at https://www.whitehouse.gov/wp-content/uploads/2023/11/Invest.gov_PublicInvestments_Map_Data_Updated11062023.xlsx, “BIL_StateLevelSummary_Data” tab, last updated November 6, 2023, reflecting BIL announced funding as of October 31, 2023. Data includes only project announcements that went to a single state; therefore, announcements for projects that cross multiple states are excluded from the dataset.
5. See, for example, Bartik, Timothy J. 2020. “Using Place-Based Jobs Policies to Help Distressed Communities.” Journal of Economic Perspectives vol. 34, no. 3, Summer 2020, pp. 99–127.; Austin, Benjamin, Edward Glaeser, and Lawrence Summers. 2018. “Jobs for the Heartland: Place-Based Policies in 21st-Century America.” Brookings Papers on Economic Activity, Spring 2018, pp. 151–232.
6. McBride, James, Noah Berman, and Anshu Siripurapu. 2023. “The State of U.S. Infrastructure.” Council on Foreign Relations, September 20, 2023. https://www.cfr.org/backgrounder/state-us-infrastructure.

